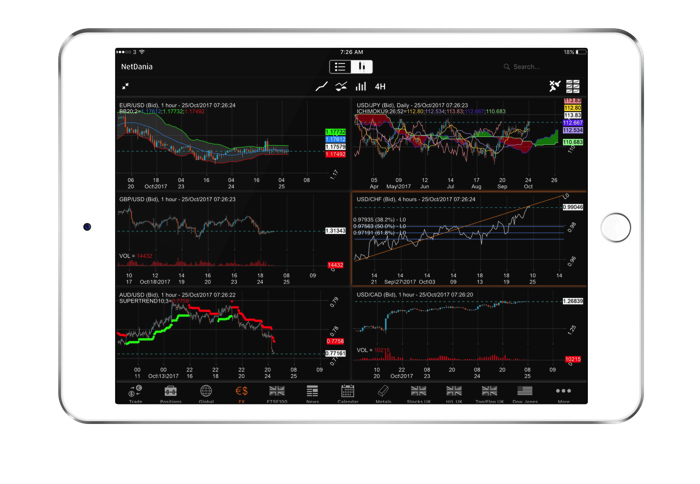
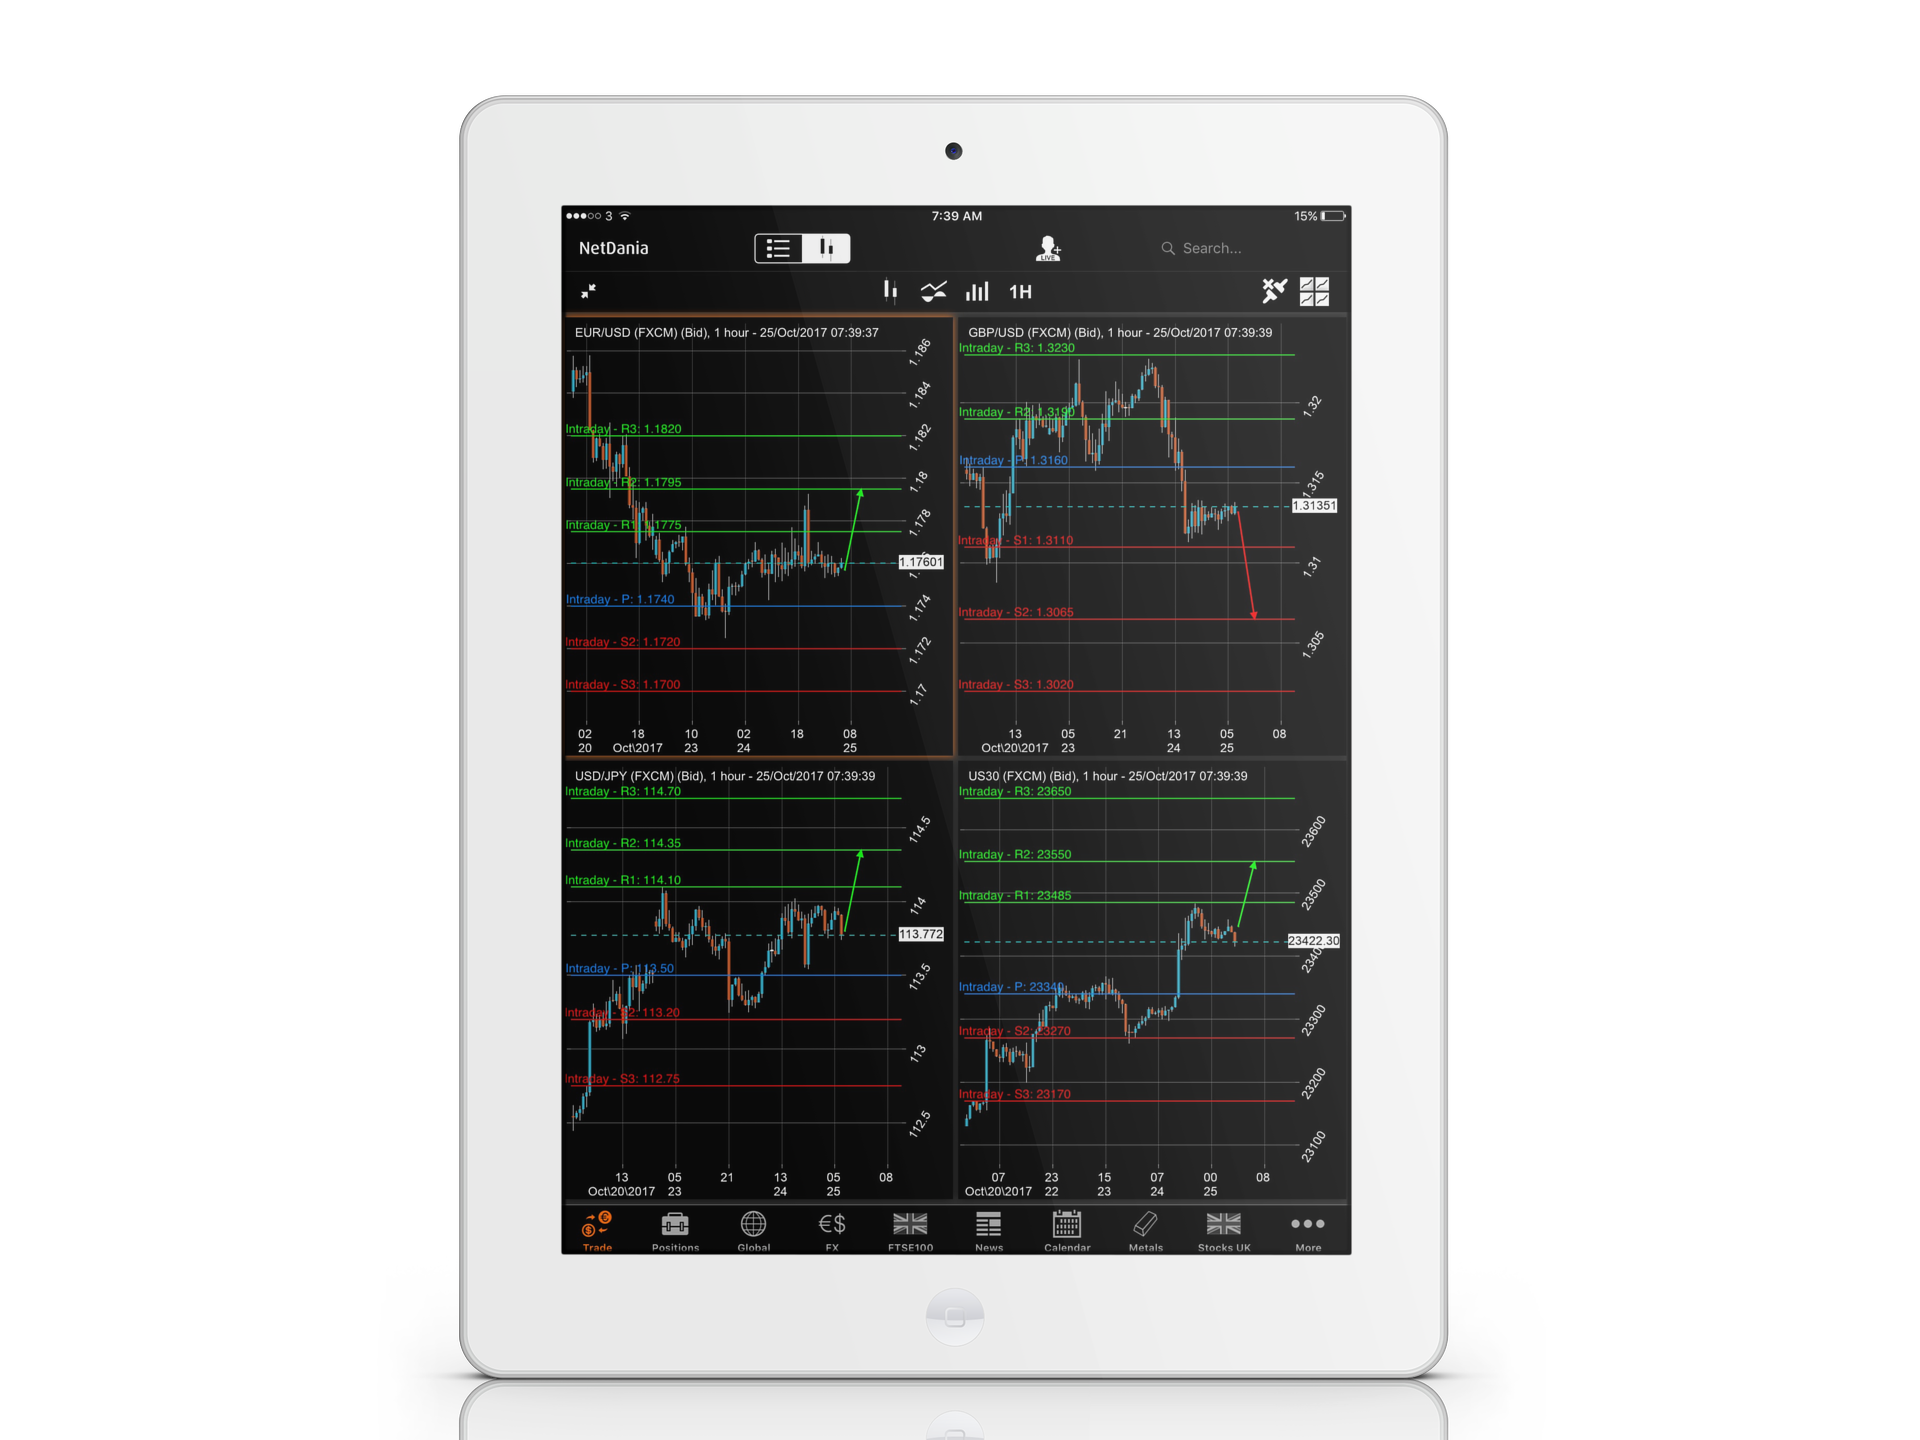
Mobile chart for iOS and Android
Probably the best chart in App Stores - Be smart and save time and costs
Beat the competition by adding our unparalleled charting framework to your mobile app

Mobile first
The mobile takes it all
According to a recent online survey conducted by J.P. Morgan among 200 institutional FX traders, 31% replied that they are likely to use mobile trading in 2017. Likewise, in 2016, several large brokerages generated more retail revenues from mobiles than from desktop. Before 2020 the vast majority of retail revenues will come from mobile devices.

Features
- 100+ studies and patterns
- Trade from Chart
- Create simple or complex algorithms using combinations of studies and pattern recognition. No programming skills are required. The information is automatically synchronized with NetStation for desktop (link to NetStation product page) (requires NetDania Cloud Services)
- 6 different chart types
- Multi-Charts
- Overlay instruments and studies, and vice versa
- 27 different time scales
- Trend-lines, Parallel lines, Fibonacci (Fans, Ext., Retracement, Arcs, Time Zones)
- Set alerts on studies and trend-lines, and receive them as push notifications and on e-mail, when triggered. The information is automatically synchronized with NetDania NetStation for desktop (link to NetStation product page) (requires NetDania Cloud Services)
- Add Shapes and Annotations
- Measurement tool
- Share charts on e-mail, Facebook, Twitter and Instagram
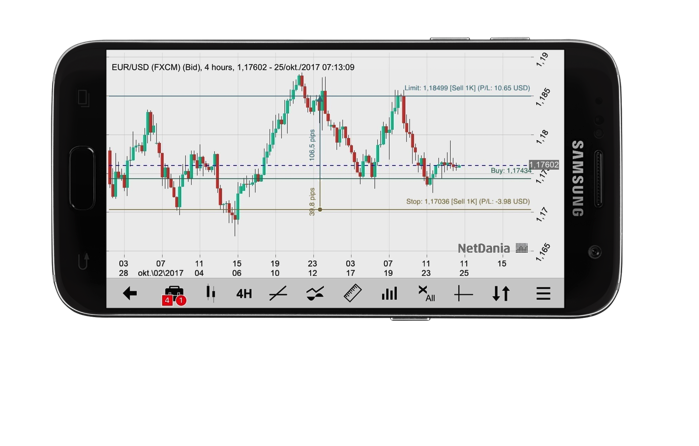
Trade from charts
The framework supports trading from charts, making these charts ideal for technical traders
- View orders and positions on charts
- Place Buy and Sell orders directly on charts
- Place entry orders on charts, by adding and dragging order lines
- Add, remove or adjust positions or their related orders (entries, stops and limits) directly on charts
API Features
The Framework comes with an extensive API suite
- Chart Data API: Feed real time/historical data into your mobile charts
- UI Components: Define studies, lines & chart interaction (change timescale, type, crosshair)
- Custom Interface Components: Replace built-in components
- Chart View UI: Component that can be embedded into other UI components, or be used as a standalone
- Chart Skin Settings: Allows for the customization of the chart display
- Chart Settings: Load/save chart settings from/to the device. Chart settings represents all information displayed on the chart, like chart type, timescale, lines and studies
Concise multi-asset forecasts
Validate trader decisions in the moment of action
Build confident traders and stimulate trading with the real-time, actionable analysis on over 7,500 global large caps, stock indices, FX, derivatives and commodities.
Analyst Views concisely conveys the key technical details on an asset, helping investors gain a clear understanding of a scenario. Trends are identified through the proprietary macro models created by TRADING CENTRAL’s awarded global research team. The price targets within each analysis show investors what they stand to gain, while the blue stop-loss line marks when a trend is reversed, helping manage their risk.
-
Receive personalized push notifications on trend reversals
-
Three different timeframes: Intraday, Short-term and Mid-term
-
Available in 30 languages
-
One-click trading on any asset

NetDania Cloud
The heart of our services
Built in-house, the highly scalable “NetDania Cloud” handles real-time data contribution and distribution, failover, synchronization between devices, execution of alerts and algorithms, push notifications, subscriber management, and much more. With nearly 20 years of hosting experience, we host the vast majority of our customers at very competitive prices.
Brochure
Download the corresponding brochure and get a closer look at features and functionalities available.
Interested to learn more?
Please fill in your details below or call us at +44 (0) 207 558 8405. We serve the worlds largest financial institutions.